


Europeans have an average per capita purchasing power of €13,894 in 2020. However, disposable net income among the 42 studied countries varies significantly. Liechtenstein, Switzerland and Luxembourg have the highest disposable net income, while Kosovo, Moldova and Ukraine have the lowest. Liechtensteiners have more than 37 times the average purchasing power of Ukrainians. These are some of the results of the newly released study “GfK Purchasing Power Europe 2020”. This year, the study also includes the Corona Impact Index, which illustrates the impact of COVID-19 on European countries.
Europeans have just under €9.5 trillion at their disposal in 2020. This corresponds to an average per capita purchasing power of €13,894. Per capita purchasing power shows a nominal decline of almost 5.3 percent in 2020 compared to last year’s revised value, which can be attributed mainly to the spread of COVID-19 and the resulting economic impact. The rankings show substantial differences between the studied countries with respect to the amount available to Europeans for food, living, services, energy, private pensions, insurance, vacation, mobility and consumer purchases.
Ireland enters the top ten
Liechtenstein once again takes first place among the 42 European countries with a per capita purchasing power of €64,240. This far exceeds the values of the other countries and is more than 4.6 times the European average. Completing the top three of the purchasing power rankings are Switzerland and Luxembourg, as was the case last year. The Swiss have €41,998 per capita available for spending – more than three times the European average – while Luxembourgers have a per capita purchasing power of €34,119. This is more than 2.5 times the European average.
All other countries in the top ten also have significantly above-average per capita purchasing power – at least 50 percent higher than the European average. Ireland makes it into the top ten this year with a per capita purchasing power of €21,030, putting it in ninth place and ousting Finland from the top ten.
Sixteen of the countries considered by the study have above-average per capita purchasing power, while twenty-six fall below the European average. Ukraine takes last place with a per capita purchasing power of €1,703.
Markus Frank, expert in GfK´s Geomarketing solution area, comments: “GfK Purchasing Power Europe is a recognized benchmark in the market for calculating consumer potential and shows the regional distribution of disposable income among the population – between individual countries as well as between the various regions within a country. In the midst of the coronavirus pandemic, it is important for companies to know where purchasing power and regional potential is highest in order to be able to make the best possible use of resources. Purchasing power is an important benchmark for the economic strength of a given region, and helps companies make business decisions related to sales management and marketing as well as location planning and evaluation.”
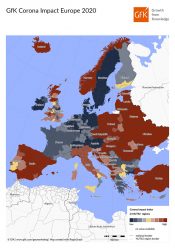
Corona Impact Index shows the effect of COVID-19 on European countries
With the Corona Impact Index, GfK has also calculated the extent to which European countries have suffered as a result of the effects of COVID-19. The Corona Impact Index shows the differences in loss of prosperity among private households as a result of the coronavirus crisis, thus facilitating both national and regional comparisons within Europe. In the purchasing power top ten, Liechtenstein and Switzerland top the rankings with the highest disposable net income per capita in Europe. They are also the two countries that have suffered least as a result of the crisis. The impact of the coronavirus in Liechtenstein is around 85 percent below the European average, while in Switzerland it is around 74 percent below the European average. Iceland and Norway, which occupy fourth and fifth places in the purchasing power rankings, fare less well in the Corona Impact Index and are 58 and 63 percent above the European average respectively. Both countries have been hit particularly hard by the coronavirus pandemic, one of the reasons being the devaluation of their national currencies against the euro. Occupying last place among the 42 countries in the rankings is Turkey, where the Corona Impact Index is more than 2.8 times the European average.
“The coronavirus crisis has had a significant effect on disposable net household income,” explains GfK expert Markus Frank. “However, there are regional differences. The Corona Impact Index therefore provides companies with useful data that illustrate the “forecast gap”, in other words the gap between the potentially achievable growth path for disposable income of private households before the outbreak of COVID-19 in Europe and the now expected national purchasing power level according to the 2020 purchasing power forecast. This data makes it possible to identify the regions that have suffered most as a result of the crisis and those that have suffered least.”
Comparison of select countries and regions
Below is a more detailed evaluation of the distribution of purchasing power in Italy, Spain, the Czech Republic, Poland, Hungary and Romania. A comparison of these countries offers insights into the regional distribution of spending potential within the respective countries.
Italy: Affluent north and poorer south
In Italy the average per capita purchasing power is €16,439. This puts Italians around 18 percent above the European average and in sixteenth place among the 42 countries considered by GfK’s study.
There is a significant north-south divide in the distribution of purchasing power between Italy’s affluent north and poorer south. All of the provinces in the top ten are located in the north of Italy. The province of Milano remains at the top of the rankings. The area around the fashion metropolis has a per capita purchasing power of €23,507, which is 43 percent above the national average and more than 69 percent above the European average. New to the top ten is the province of Firenze, which occupies tenth place and ousts the province of Valle d’Aosta/Vallee d’Aoste from the top ten. The provinces of Monza e della Brianza and Genova switch fifth and eighth places in the rankings.
The ten least affluent provinces are all located in southern Italy. Last place goes to Crotone, which is situated in the country’s far south. Inhabitants of this province have a per capita purchasing power of €9,119, which is around 45 percent less than the national average and around 34 percent less than the European average.
Spain: Alone in the midfield
Spain has a 2020 per capita purchasing power of €13,613, which puts it just 2 percent below the European average. No other European country is close to this value – Italy is more than 18 percent above the European average, while Slovenia is just under 15 percent below the European average. This puts Spain alone in the European midfield.
In the ranking of the Spanish provinces, Araba/Alava, the southernmost of the three provinces of the Basque Autonomous Community, once again takes first place. Inhabitants of this province have €17,620 per capita for consumer purchases, which is more than 29 percent above the national average. There also have been a couple of changes in this year’s top ten. Bizkaia and Barcelona have switched fourth and fifth places. New to the top ten this year are the provinces of Zaragoza, Burgos and Asturias in places seven through nine, replacing last year’s top-ten provinces of Tarragona, Lleida and Girona.
Spain’s least affluent provinces are all located in the southwestern part of the country. While the Andalusian province of Cadiz occupied last place in the rankings in previous years, this year it moves up to second-to-last place. Taking last place in this year’s rankings is Spain’s largest province, Badajoz, with a per capita purchasing power of €9,975, which is around 27 percent below the national average.
Czech Republic: Highest purchasing power in and around the country’s largest cities
The Czech Republic has a per capita purchasing power of €9,179, which puts it almost 34 percent below the European average and in twenty-fifth place among the 42 countries in the study.
The capital city district of Prague once again tops the purchasing power rankings. Inhabitants of this district have €11,961 per capita available for spending and saving, which is more than 30 percent above the national average. However, the purchasing power of the inhabitants of Prague is still almost 14 percent below the European average. The two bordering districts of Praha-zapad and Praha-vychod also have above-average purchasing power, as does the Czech Republic’s second largest city, Brno-mesto.
There have been a few changes in the top ten this year, with Brno-mesto and Praha-vychod switching places three and four and Beroun, Hradec Kralove and Benesov also changing places in the rankings. A new entry this year is the district of Kladno, which secures the final place in the top ten with a per capita purchasing power of €9,328. Bringing up the rear in the district rankings is Jesenik in Northern Moravia, located on the border with Poland. The district’s inhabitants have a per capita purchasing power of €7,597, which is almost 83 percent of the national average and around 55 percent of the European average.
Poland: Sharp contrast between rich and poor
The average per capita purchasing power in Poland in 2020 is €7,143, just under 49 percent below the European average. This puts Poland in twenty-eighth place in the European rankings.
There is an especially large gap between rich and poor in Poland with respect to the distribution of purchasing power in the country’s 380 districts. Only 17 districts have a per capita purchasing power that is at least 20 percent higher than the national average. By contrast, 106 districts are at least 20 percent below the national average. With a per capita purchasing power of €12,120, the capital city district of Warsaw takes first place. Inhabitants of the capital district have almost 70 percent more money for consumer purchases and saving than the national average.
At the other end of the district rankings is Szydlowiecki, where the per capita purchasing power is just €4,721. This corresponds to almost 66 percent of the Polish average and 34 percent of the European average. Inhabitants of Warsaw have almost 2.6 times more money available than the inhabitants of the least affluent district of Szydlowiecki.
There has been little change in the top places of the purchasing power rankings this year. The districts of Krakow and Bielsko-Biala switch eighth and ninth places. Gliwice makes it into the top ten with a per capita purchasing power of €9,111, putting it in tenth place and ousting the district of Tychi.
Hungary: Purchasing power highest around capital city and toward the Austrian border
Hungary’s average per capita purchasing power is €6,871, which is a little less than half the European average. As such, Hungary is ranked thirtieth.
Looking at the 20 counties of Hungary, it is clear that the areas with the highest purchasing power have managed to hold on to their place in the rankings. The capital city county of Budapest continues to lead the rankings by a significant margin. With €8,627 per capita, inhabitants of Budapest have almost 26 percent more purchasing power than the national average, but still almost 38 percent less than the European average.
Five of Hungary’s 20 counties have above-average purchasing power. All of these counties are located in and around the capital city of Budapest and toward the Austrian border. By contrast, three-fourths of Hungary’s counties have below-average purchasing power. Last place goes to Szabolcs-Szatmar-Bereg, whose inhabitants have a per capita purchasing power of €5,392, which is less than 79 percent of the national average and around 39 percent of the European average.
Romania: Capital has by far the highest purchasing power
Romania is thirty-first in the European rankings, just below Hungary. With an average per capita purchasing power of €5,611, Romania is around 60 percent below the European average.
Like Poland, Romania has a very big gap between rich and poor. The capital city county of Bucuresti leads the rankings by a significant margin. Inhabitants of this county have €10,173 per capita available for spending and saving, which is more than 81 percent above the national average. The people of Bucharest have more than three times the purchasing power of the inhabitants of the least affluent county, Vaslui. Here, disposable net income is just €3,374, which is around 60 percent of the national average and just over 24.3 percent of the European average.
Arad, Arges and Prahova each move up one place in the rankings to positions seven through nine, while Hunedoara drops out of this year’s top ten. New in tenth place is the district of Alba, whose inhabitants have a per capita purchasing power of €5,747, which is more than 2 percent above the national average.
About the study
The study “GfK Purchasing Power Europe 2020” is available for 42 European countries at detailed regional levels such as municipalities and postcodes, along with seamlessly fitting data on inhabitants and households as well as digital maps.
Purchasing power is a measure of disposable income after the deduction of taxes and charitable contributions and including any received state benefits. The study indicates per-person, per-year purchasing power levels in euros and as an index. GfK Purchasing Power is based on the population’s nominal disposable income, which means values are not adjusted for inflation. Calculations are carried out on the basis of reported income and earnings, statistics on government benefits as well as economic forecasts provided by economic institutes. In cases where there are different scenarios from economic research institutes, the average scenario is always selected for the purposes of calculating GfK Purchasing Power 2020, which assumes a delayed recovery into next year along with the availability of effective medical treatments for the coronavirus in the middle of 2021.
Consumers draw from their general purchasing power to cover expenses related to eating, living, services, energy, private pensions and insurance plans as well as other expenditures, such as vacation, mobility and consumer purchases.
This year, GfK also releases the Corona Impact Index, which shows the differences in lost disposable net income due to the coronavirus crisis at national and regional level. Calculations are carried out on the basis of the latest information and forecasts for household net income, private household consumer spending and changes in gross domestic product. These values are assessed in relation to the forecasts prepared available before COVID-19. The resulting deviation is traced back to the effects of the coronavirus crisis. Exchange rate changes are also included in the calculation.
For the purposes of regionalization of the Corona Impact Index, data on the industry structure in the regions is used along with country-specific values relating to short-time work and unemployment since the start of the pandemic. Unemployment and short-time working can illustrate the impact on the purchasing power of the population.